XRP's Next 90 Days: Three Paths From $1.37
XRP gained 23.3% last quarter, but at 71.1% annualized volatility the next quarter could go several ways, and the payments story behind it is harder to measure than the price.

Key takeaways
- →XRP rose from $1.11 to $1.37 over the past 90 days, a 23.3% gain, putting its market cap near $86.5 billion.
- →Annualized volatility of 71.1% means a quarter-sized move in either direction is normal, not a signal.
- →The deepest pullback in the window was 15.1%, from Aug 23 to Sep 15. That's the yardstick for whether the uptrend is still intact.
- →Our data pack has no On-Demand Liquidity or corridor volume figures, so treat adoption claims as something to verify, not a number to price in.
- →Each scenario below names what would prove it wrong over the next 90 days.
XRP closed the last 90 days up 23.3%, at $1.37. That number says less about the next quarter than it seems to. A gain that size on a coin this volatile is ordinary. The real question is whether the things people say drive XRP (cross-border payment corridors, On-Demand Liquidity (ODL) usage, regulation) actually show up in the price, or whether the price is just doing what volatile assets do.
Below are three paths for the next 90 days, running roughly to mid-January 2027. None is a forecast. Each is tied to numbers from our own price history, and each comes with a condition that would break it.
Where XRP stands
Here's the quarter in brief:
| Metric | Value |
|---|---|
| Price (Oct 13, 2026) | $1.37 |
| Price 90 days ago | $1.11 |
| 90-day change | +23.3% |
| Market cap | About $86.5 billion |
| Annualized volatility | 71.1% |
| Max drawdown | 15.1% (Aug 23 to Sep 15) |
| Best day | +14% (Aug 21) |
| Worst day | -11% (Sep 15) |
Read the dates in order. The best day landed on Aug 21. The run peaked two days later. XRP then spent more than three weeks sliding 15.1%, and the slide ended on its worst single day, Sep 15. From there it recovered enough to finish the quarter well above its start.
So no, it wasn't a smooth climb. It was a spike, a grind lower, a capitulation day and a rebound. Draw a straight line from $1.11 to $1.37 and you've missed most of the story.
The part the data can't tell you
The angle here is payments: institutional corridors, ODL volume, regulatory decisions. Our data pack has none of that. No ODL volume, no corridor counts, no on-chain payment figures. Price history only.
That gap matters. XRP rallies often get explained by adoption news after the fact. Sometimes the explanation holds. Sometimes a 14% day is just a 14% day, driven by broader market flows or leverage. Without volume data beside the price, you can't separate the two. So in the scenarios below, adoption and regulation show up as conditions to check, not as numbers built into the outlook.
If you want to test the payments thesis yourself, the question is simple. Does reported ODL or corridor activity rise before price moves, or only get cited afterward? If it's the latter, the story is decoration.
Scenario 1: The range holds
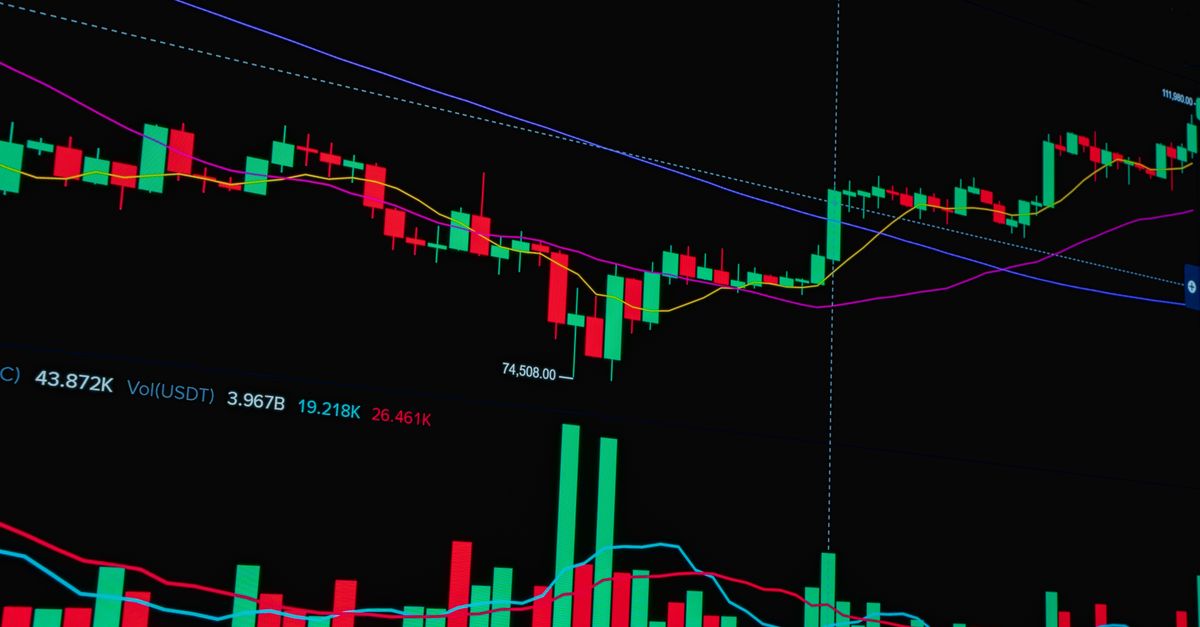
The setup: volatility stays near 71.1% annualized and XRP chops sideways with no clear trend. Pullbacks stay within the 15.1% depth we saw in August and September. The price neither gives back the quarter's gains nor adds much to them.
This is the default for a coin coming off a sharp drawdown and recovery. Markets often digest moves like that sideways. It's also what you'd expect if payments news stays incremental: corridor announcements and partnership headlines that don't change the flow of money in any way the market can see.
What proves it wrong: a pullback deeper than 15.1% from any new high, or a sustained push that leaves the recent range behind. Either one means the market has picked a direction.
Scenario 2: The uptrend extends
The setup: XRP holds above $1.37 on dips and keeps printing higher highs. For that to be more than momentum, you'd want something underneath it. Measurable growth in ODL usage. New institutional corridors that actually carry volume. Regulatory clarity that lets more payment firms use XRP without legal hesitation.
Here's the catch. Last quarter showed XRP can rally hard in a day, as the 14% move on Aug 21 did, and then hand a good chunk of it back. An adoption-driven trend would look different. Gains would be steadier and drawdowns shallower than 15.1%. That's the tell.
What proves it wrong: a drop back below $1.37 that doesn't recover quickly, especially one with a drawdown matching or beating the August-September slide. Also watch for adoption headlines that arrive and don't move the price. If good news can't lift it, the bull case is thinner than it looks.
Scenario 3: The gains unwind
The setup: the September weakness turns out to be a beginning, not an end. XRP drifts back toward its starting level of $1.11 and erases the quarter's 23.3% gain.
It sounds dramatic. At 71.1% volatility, it isn't. A full reversal of last quarter's move fits comfortably inside the swings this coin produces. Triggers could include an unfavorable regulatory development, a broad crypto sell-off that drags XRP down regardless of fundamentals, or payments activity that stalls after heavy promotion.
Remember Sep 15. An 11% single-day drop happened once this quarter. It can happen again, and drawdowns tend to feed on themselves when leveraged traders get forced out.
What proves it wrong: XRP holding above $1.37 through the next sharp sell-off in the broader market. If it takes a hit and recovers fast, the downside case loses its footing.
How to weigh these
Skip the tidy probabilities. The data doesn't support that kind of precision. It does support a clear sense of scale. This is a roughly $86.5 billion asset that moved 23.3% in a quarter, fell 15.1% inside that same quarter, and had single days of +14% and -11%. Size a position as if XRP were stable and you've sized it wrong.
The payments narrative is the real wildcard, and the hardest piece to verify. Corridor adoption and ODL volume could be what finally separates XRP's price from the rest of the crypto market. Or they could keep serving as after-the-fact explanations for moves that were really about sentiment and leverage.
Over the next 90 days, the most useful thing to watch isn't the price level. It's whether the next drawdown is shallower or deeper than 15.1%. That one number will tell you more about which scenario is playing out than any headline will. And if adoption really is growing, why hasn't it made XRP any less volatile yet?
Not financial advice
This analysis is for information and education only. Figures are computed from CryptoCMD's own daily price history and can lag the live market. Crypto prices are volatile; scenarios are possibilities, not predictions. Never stake or invest money you can't afford to lose.