
BNB Tracked Bitcoin. LEO Barely Moved. Neither Proves the Burn
Over the last 90 days BNB moved almost exactly like Bitcoin, while LEO sat apart from the market. Our price data can't show whether burns and buybacks caused either result.
Key takeaways
- →BNB fell 4.7% over 90 days against Bitcoin's 5.4%, but its max drawdown was worse: 25.3% vs 24.2%.
- →BNB's correlation to BTC was 0.78, so it gave little diversification inside a crypto portfolio.
- →LEO's correlation to BTC was 0.11, its annualized volatility 18.2%, and its max drawdown 8.6%.
- →Ethereum, the large cap with no exchange behind it, did worst: down 18.4% with a 33.9% drawdown.
- →Price data alone can't separate burn and buyback effects from everything else moving these tokens.
Over the last 90 days, BNB didn't beat Bitcoin. It matched it, near enough. LEO is the real oddball, and it doesn't hand token-burn fans the story they'd like.
Here's the usual pitch for exchange tokens. The exchange earns fees, spends some of them buying back or burning its own token, and that steady demand is supposed to cushion the falls. If that worked, you'd expect shallower drawdowns and a looser link to Bitcoin. So we tested both against our own daily price data for the 90 days to November 16, 2026, setting BNB and LEO beside Bitcoin and Ethereum.
The scoreboard
| Coin | Market cap | 90-day change | Annualized volatility | Max drawdown | Correlation to BTC |
|---|---|---|---|---|---|
| Bitcoin (BTC) | $1.30 trillion | -5.4% | 42% | 24.2% | — |
| Ethereum (ETH) | $220.5 billion | -18.4% | 50.6% | 33.9% | 0.93 |
| BNB | $77.5 billion | -4.7% | 42.2% | 25.3% | 0.78 |
| LEO Token | $8.47 billion | -2% | 18.2% | 8.6% | 0.11 |
Every one of them lost money. What's interesting is how.
BNB is a Bitcoin proxy with a different logo
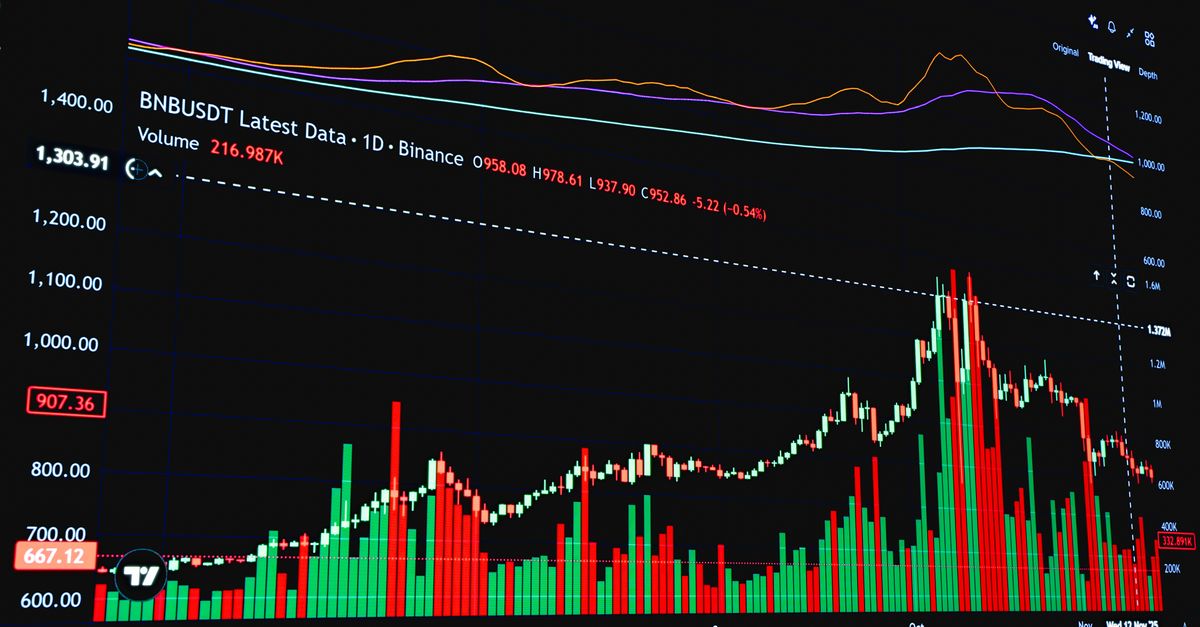
Put BNB next to Bitcoin and the numbers nearly line up. Bitcoin fell 5.4%, BNB fell 4.7%. Annualized volatility: 42% for Bitcoin, 42.2% for BNB. That's a rounding error.
On the end-to-end change, BNB edged ahead. On drawdown, it did slightly worse. BNB dropped 25.3% from peak to trough, against Bitcoin's 24.2%. It also peaked sooner. BNB's slide ran from September 21 to November 15, while Bitcoin's started October 4 and ended the same day. So BNB began sliding about two weeks earlier, fell a bit further, and hit bottom on the very same day.
The 0.78 correlation tells you the rest. Most days, when Bitcoin moved, BNB moved the same way. It's not as tight as Ethereum's 0.93, but it's nowhere near independent. If you hold BTC and add BNB hoping to soften a crypto selloff, this window says you mostly bought more of the same exposure.
One detail breaks the pattern. BNB's worst day was October 29, at -7.2%. That's worse than Bitcoin's worst day of -6.4%, and it landed on a different date. Bitcoin's and Ethereum's worst days both came on November 5. BNB's best day was smaller than theirs too: +5.9% on September 5, versus +7.7% for Bitcoin and +8.7% for Ethereum on August 21. So a smaller best day and a bigger worst day than Bitcoin. A bit lopsided. It's one 90-day window, so don't read too much into it, but it cuts against the idea that buybacks put a floor under the price.
The fair comparison is Ethereum, and BNB beat it
Judging BNB against Bitcoin is a little unfair. Bitcoin is the market's anchor. A better test is another large cap that's more than Bitcoin with extra steps, and Ethereum is the obvious pick.
Here BNB looks good. Ethereum lost 18.4% over the window; BNB lost 4.7%. Ethereum's drawdown was 33.9%, BNB's 25.3%. Ethereum's volatility was higher too, 50.6% against 42.2%. Both drawdowns started September 21 and ended November 15, so the two coins went through the same stretch of pain. BNB just took less of it.
So there's a case that BNB held up better than a comparable large cap. What the data can't tell you is why.
LEO: low volatility, low correlation, low information
LEO is the strangest row in the table. Its annualized volatility of 18.2% is under half of Bitcoin's. Max drawdown: 8.6%. Correlation to Bitcoin: 0.11, which is about as close to no relationship as you get. Against BNB it was 0.09.
Timing matters too. LEO's drawdown ran from August 29 to September 15, before the October–November selloff that hit everything else. While Bitcoin lost nearly a quarter of its value, LEO didn't make a new low. Its worst single day was -2.2%, on October 1. Its best was +3.9%, on October 28, the day before BNB's worst.
Skim it and it looks like the perfect hedge. Read it closely and it looks like a token that barely trades like a crypto asset at all. Very low correlation plus very low volatility usually points to thin price discovery. A small group of holders and the issuer's own activity can matter more than market mood. LEO finished the window 2% lower. Steady is a fair word for that. Proven isn't.
Do burns and buybacks show up in the numbers?
Honestly? Not in any way we can isolate. Our data pack holds prices, returns, volatility, drawdowns and correlations. It has no burn amounts, no buyback schedules, no supply changes. Without those, saying a burn caused a given price move is storytelling, not analysis.
What we can say is narrower:
- BNB behaves like a high-beta large cap that happened to beat Ethereum this quarter. If buybacks helped, they didn't stop a 25.3% drawdown. They didn't stop a worse single-day drop than Bitcoin's either.
- LEO is so loosely tied to the market that its stability could come from issuer support, thin trading, or both. Price data can't separate those.
- Ethereum, the large cap with no exchange behind it, did worst on every measure in the table. That nudges the exchange-token case a little. Four coins over 90 days doesn't settle anything.
The burn story might be true. These numbers just can't confirm it.
What this means for you
If you hold
Don't count BNB as diversification. With a 0.78 correlation to Bitcoin, it piles more onto the same risk. If you want something that zigs when BTC zags, BNB isn't it. LEO's low correlation looks tempting. Ask yourself whether you could actually sell a big position at a fair price when you needed to.
If you trade
BNB's volatility is effectively Bitcoin's, so size positions the same way. Watch for BNB-specific shocks, like the October 29 drop that hit on a different day from the market's worst session. LEO's 18.2% volatility leaves less room for swing trades. Low volatility also means smaller moves to profit from.
If you gamble
Treat this as an example only. Put $100 on BNB at the start of its worst day and you'd have lost 7.2% of it in one session. The same $100 in LEO on its worst day lost 2.2%. If you're betting on short-term direction, BNB hands you Bitcoin-sized swings, both ways. LEO mostly won't hand you anything to bet on.
How we did the math
We used daily closing prices from our own price history over the 90-day window ending November 16, 2026. Volatility is the standard deviation of daily log returns, annualized. Correlations are Pearson coefficients of daily returns between each pair of coins.
Here's the open question. If LEO's stability comes from the issuer standing behind the price, what happens to that 0.11 correlation the first time the issuer can't?
Not financial advice
This analysis is for information and education only. Figures are computed from CryptoCMD's own daily price history and can lag the live market. Crypto prices are volatile; scenarios are possibilities, not predictions. Never stake or invest money you can't afford to lose.